• Services
    • Geotechnical Investigations
    • Landslides
    • Soil Testing
    • Groundwater
    • Wastewater
    • Coasts
    • Contaminated Sites
  • Products
    • Cromer Hydrogeological Calculators
    • Cromer Constant Head Field Permeameter
    • Trench® Wastewater Software
  • About
  • News
    • News Archive
  • Publications
    • Cromer Reports Database
  • Contact me

Bill Cromer

Home » News » Vulnerable Coasts and Sea Levels

Flowchart for applying the Tasmanian Coastal Erosion Hazard Code

August 12, 2016 by Bill Cromer Leave a Comment

I’ve produced a PDF flowchart to help people navigate through the Tasmanian Coastal Erosion Hazard Code.

The Code aims to mitigate the risk to life and property due to coastal erosion, recession and wave run-up under current and future sea level change. It is one of many in the 2015 Interim Planning Scheme used by all Tasmanian Local Councils. See the list of Codes including the ones for which I offer professional services.

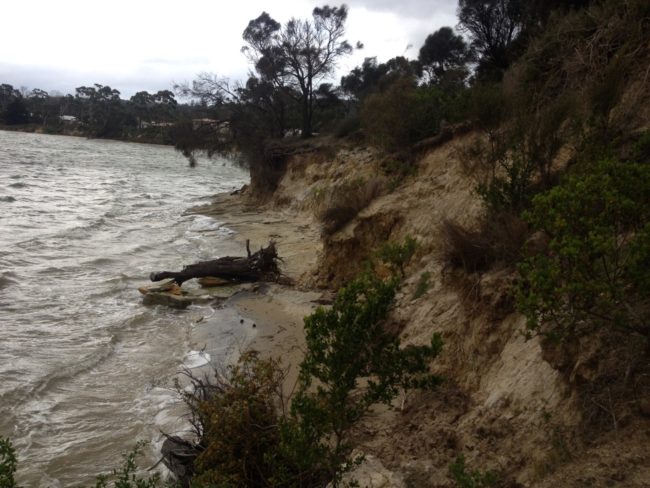
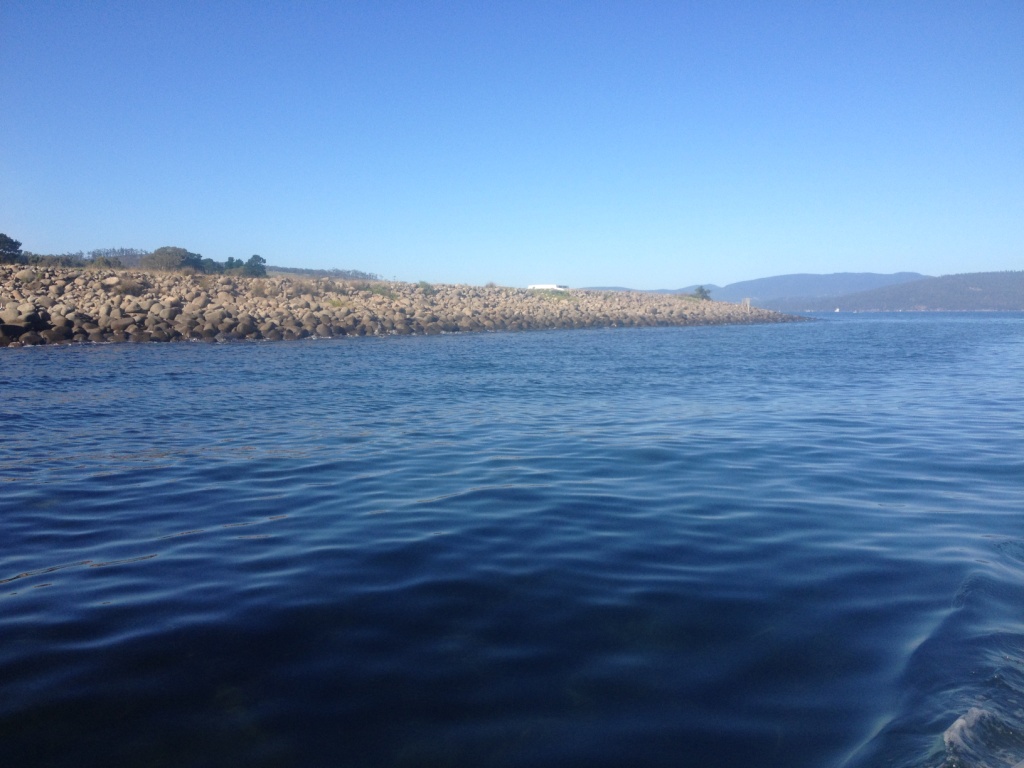
The Code applies to development applications (like new houses) for waterfront properties which are in Coastal Erosion Hazard bands. The bands denote susceptibility of a coast to erosion, and are coloured red (high erosion hazard), orange (medium) or yellow (low). A few coastal areas are coloured green (“Coastal erosion investigation area”) where the level of erosion susceptibility is uncertain and requires further investigation.

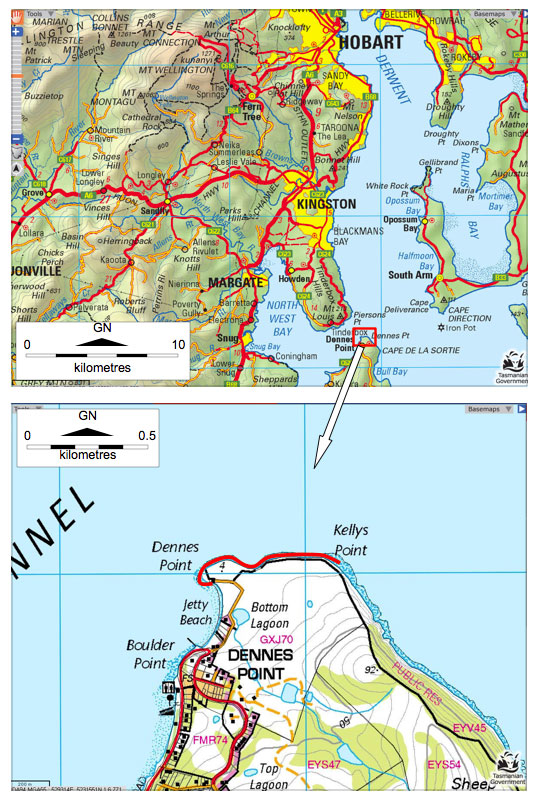
Read about how bands are defined and mapped around Tasmania’s coastline in the very comprehensive 2013 coastal erosion report (PDF document) by Chris Sharples, Hannah Walford and Luke Roberts, and issued by the Tasmanian Department of Premier and Cabinet (DPAC).

If you are thinking about buying waterfront land and/or building a house on it, you are strongly advised to check its erosion hazard banding on the state government website www.thelist.tas.gov .au

On the home page, click “LISTmap”; double click on the location of interest and continue to double click (or use the mouse wheel) to zoom in; click “Layers” at top right, then click “Add Layer +”. In the menu box that opens, scroll down to “Coasts and Oceans and Estuaries”, click on “Coastal Vulnerability” and click on the circular green + icon for “Coastal Erosion Hazard Bands”. You may need to zoom in further until the bands are visible. Drag the menu box out of the way (or close it). At top right of the screen, click on the tiny arrow in the “Coastal Erosion Hazard Bands” box to see the Legend and change the transparency.

Some development applications are exempt from the Code.

If the Code applies to an application, your Local Council will require “more information” before approving or rejecting it.

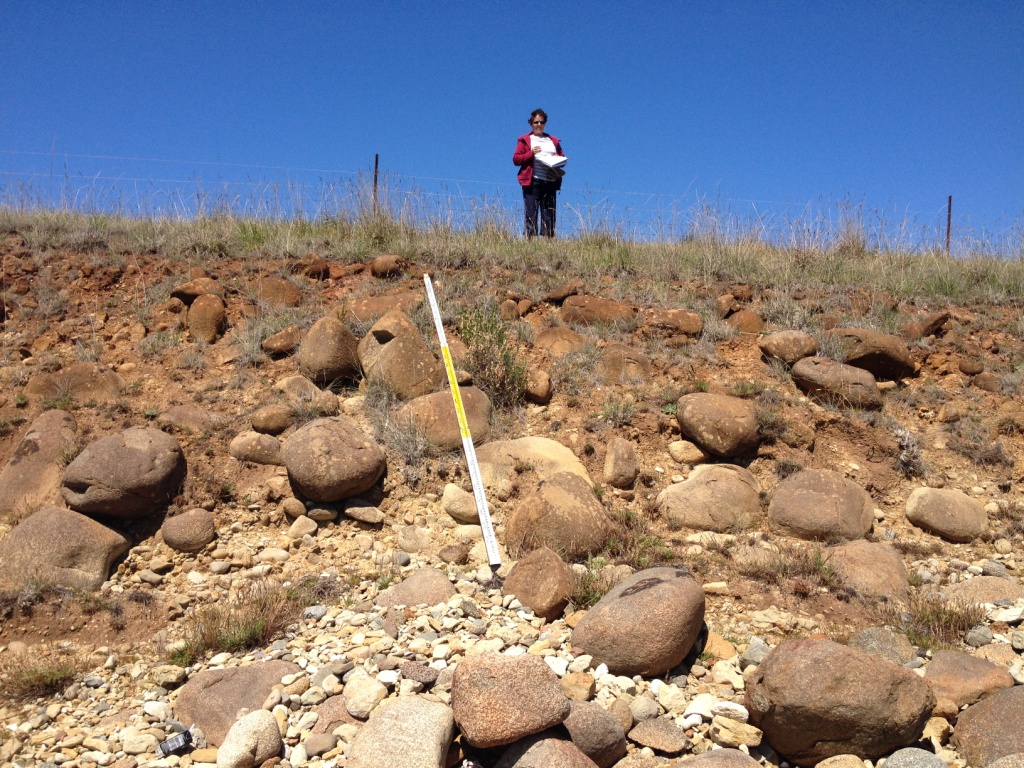
The flowchart is designed to help everyone understand the situations in which the Code applies, and what Local Councils require in order to consider a development application in a Coastal Erosion Hazard band. Generally speaking, some form of reporting by a “Suitably Qualified Person” is needed. (The qualifications or experience of this person are not defined, but I regard myself as one) Site investigations – of a mainly geotechnical nature – may be required before a report can be prepared.

Local Council may approve or reject a report (and your development application). If approved, complying with the requirements of the Code may add costs to your proposed development.

If you think your proposed development might be in a Coastal Erosion Hazard band, you should get its accuracy checked in the field by a suitably qualified person. This is because on the www.thelist.tas.gov.au website, DPAC states “…Hazard bands as depicted in this map may not accurately represent the existence or otherwise of hazards in the mapped area. Independent expert advice should be sought if action is to be taken that may be impacted by the existence or otherwise of hazards in the mapped area.”

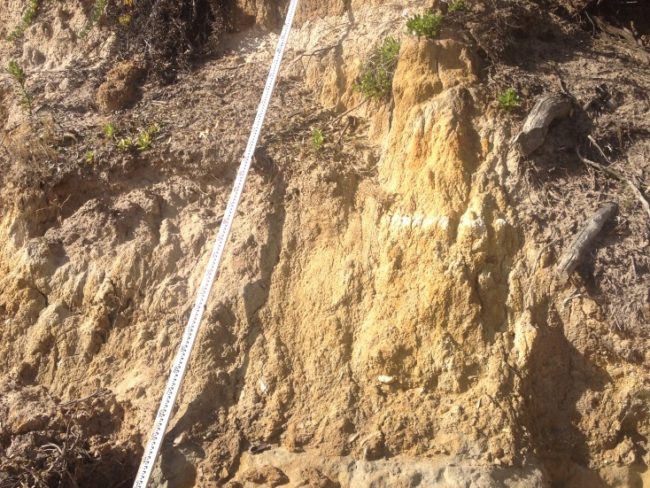
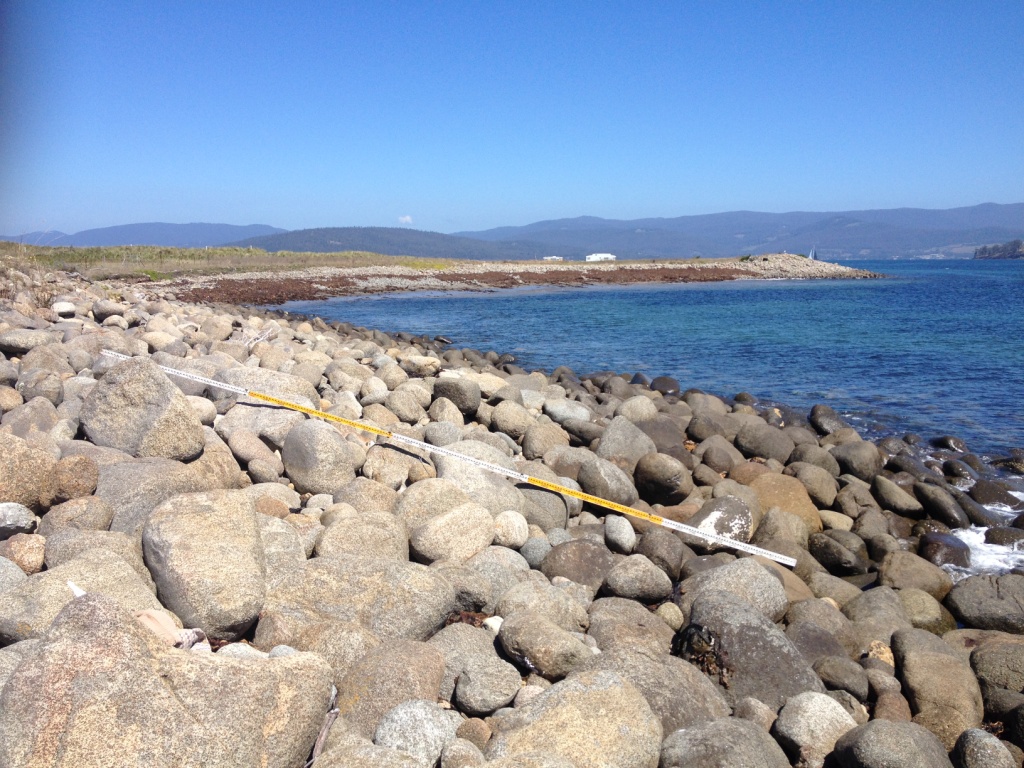
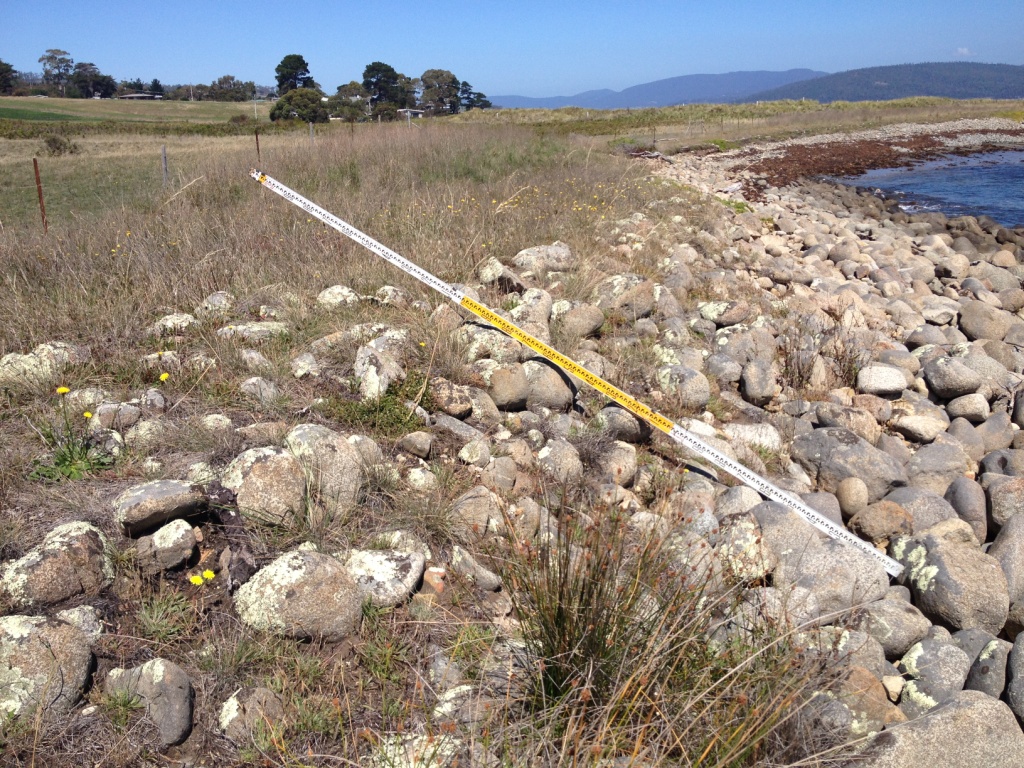
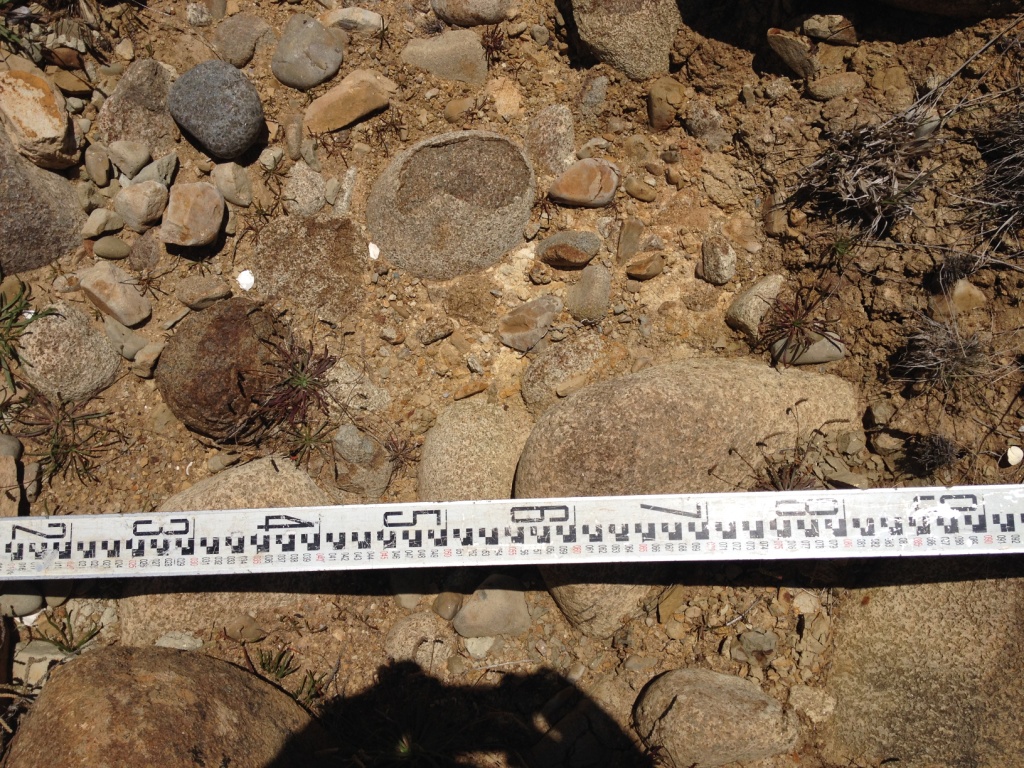
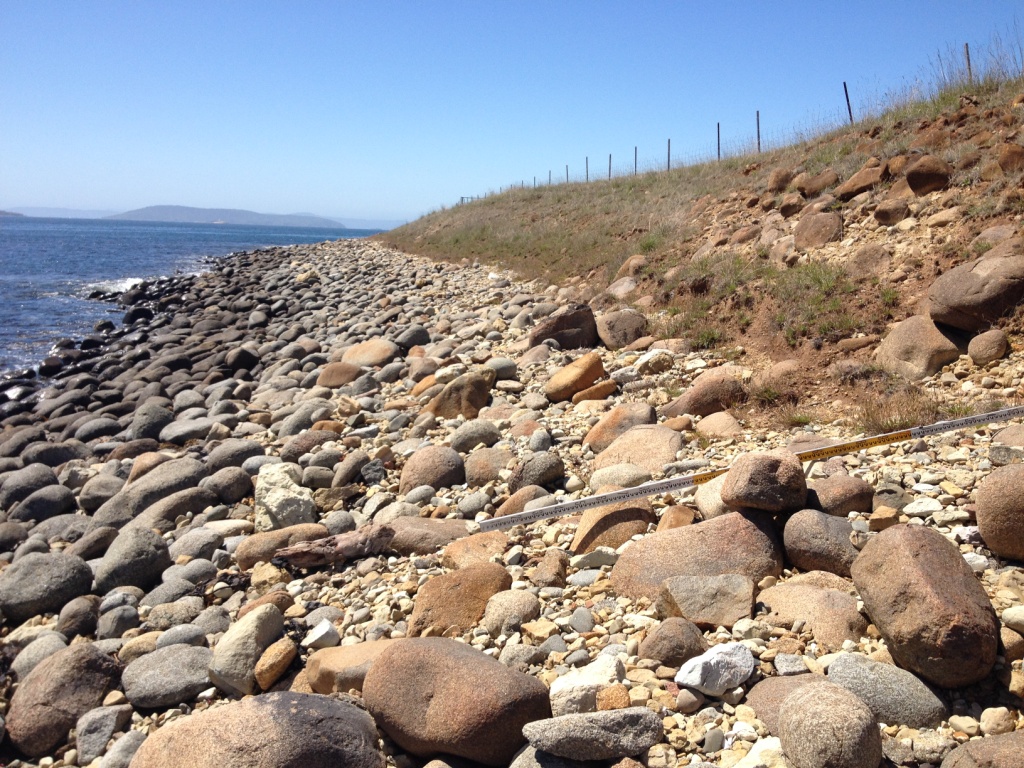
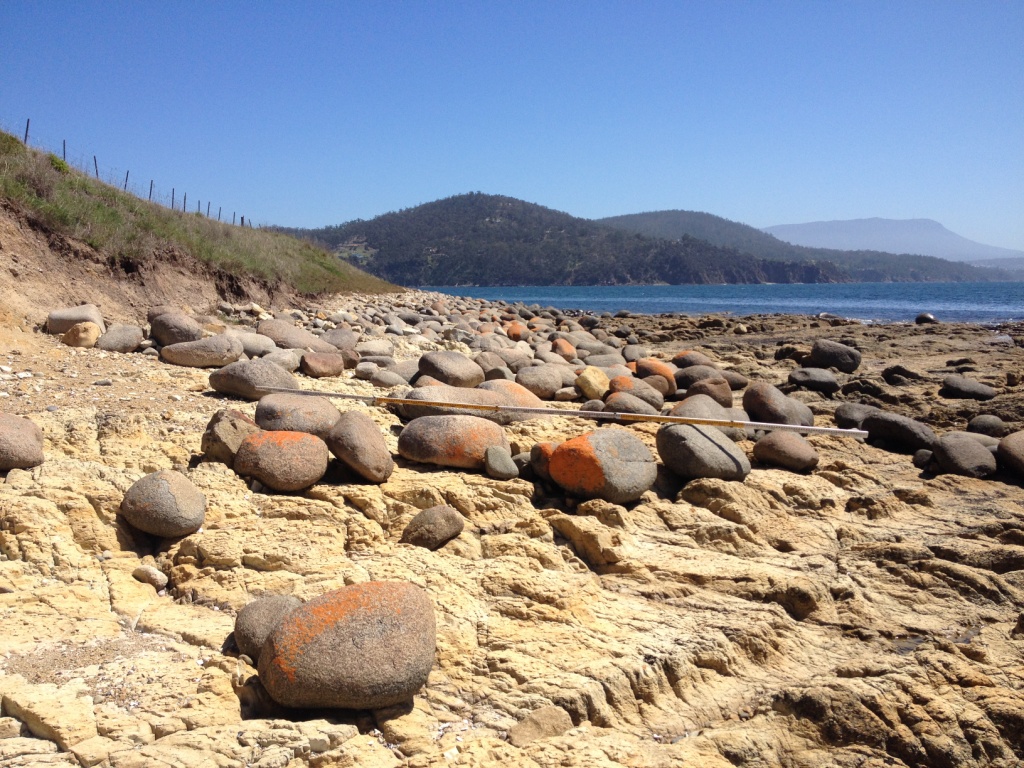
Checking the accuracy of a Coastal Erosion Hazard band is done primarily by site inspection to review the topography and geology of the property and environs, and perhaps undertaking subsurface investigations on it.

I’ve heard that some real estate agents are unaware of the Coastal Erosion Hazard bands, and the Code, so be alert.

Other Codes may potentially affect your development application. These include but may not be restricted to the On-site Wastewater Management Code, the Landslide Code, and the Acid Sulphate Soils Code. I provide advice on these three Codes. See my May 2016 news posts about them, and the accompanying flowcharts I’ve produced for them.

A 1.5m high erosion scarp at Spring Beach near Orford in southeastern Tasmania.
In September 2009, storm waves at Spring Beach near Orford produced an erosion scarp 1.5m high. The beach is a “soft” shoreline and is in the red (high) Coastal Erosion Hazard band.
The vertical face of a 5m high actively eroding soft shoreline
A 5m high active erosion scarp on a “soft” shoreline of unconsolidated sediments in southeastern Tasmania. The shoreline is in a green (uncertain) Coastal Erosion Hazard band. Site investigations amended the banding to red backed inland by orange and yellow.
An actively eroding, soft shoreline at Dodges Ferry in southeastern Tasmania
An actively eroding “soft” shoreline at Dodges Ferry in southeastern Tasmania is in the green (uncertain) Coastal Erosion Hazard band. Resistant and “hard” sandstone bedrock visible at sea level rises inland beneath erodible sediments. This observation, and investigations for a new house 50m inland, demonstrated that the house site was not at risk of erosion and should be placed in the “Acceptable” band. It would then be exempt from the Coastal Erosion Hazard Code.

Filed Under: Vulnerable Coasts and Sea Levels

Monitoring groundwater in vulnerable coasts in southeastern Tasmania

June 17, 2015 by Bill Cromer Leave a Comment

I have recently been engaged by Kingborough Council in southeastern Tasmania to set up groundwater monitoring sites in Kingston Beach (pictured), and Adventure Bay on Bruny Island. Both are low-lying beachside precincts, and their real estate and buried infrastructure (sewer pipes, gas and power networks, etc) are most at risk from rising water tables caused by rising sea levels. Browns River (catchment area 60km2) discharges to the River Derwent at Kingston Beach, and Captain Cook Creek (catchment area 17km2) flows to the sea at Adventure Bay. From a surface flood perspective, the worst-case scenario at any time is high intensity rainfall + high tide + storm surge – a situation which will increase in frequency and impact as sea and groundwater levels rise.

Digital water level recorders are being installed in shallow, screened boreholes at both towns. Water table fluctuations caused by tides, rainfall, groundwater extraction and rising sea level will be captured. The data, downloaded quarterly or twice-yearly, will be used to calibrate a numeric groundwater model for Kingston Beach (at least) and will contribute to storm modelling being compiled by Council.

The monitoring bores are intentionally located at proposed Tasmarc transects.


Kingston Beach, Tasmania
Kingston Beach, looking south, May 2015


Filed Under: Vulnerable Coasts and Sea Levels

Beach watch around Tasmania

June 6, 2015 by Bill Cromer Leave a Comment

I’ve volunteered to do TASMARC beach surveys. And I’ve been accepted(!).

It makes good sense to closely watch what is happening to our coasts – especially the so-called “vulnerable” or “soft” sandy shores which change shape hourly, daily, weekly, monthly, yearly…..with weather and tides, and at longer time frames with changing climate.

In Tasmania, TASMARC has been doing this since 2004, at now about forty or so beaches around this island. The organisation was set up by Chris Sharples, John Hunter and others at the University of Tasmania concerned that we knew little about the way our sandy shorelines were changing (or not changing)

The surveys are done by volunteers – mostly from land and coast care groups – and there is a lot of support from southern local councils, the Antarctic Climate & Ecosystems Cooperative Research Centre, the University of Tasmania, the Department of Primary Industries Parks Water and Environment, Natural Resource Management and Cradle Coast Authority.

Surveys are done at times which suit volunteers – usually a few times a year. Results are emailed to TASMARC, where Nick Bowden maintains the database. So the profiles of many of our beaches are being archived. The information is freely available to everyone.

Look out for me on Nutgrove Beach in Hobart. I’m also volunteering to survey Nebraska Beach at Dennes Point on Bruny Island, where we happen to have a rental holiday shack.

Filed Under: Vulnerable Coasts and Sea Levels

An unusual boulder spit at Dennes Point on Bruny Island

March 5, 2015 by Bill Cromer Leave a Comment

I’m collaborating with expert coastal geologist/geomorphologist Chris Sharples to report on an unusual occurrence of boulders at the extreme northern tip of Bruny Island in southern Tasmania. The rounded, moderately-graded, mostly dolerite boulders (and cobbles) up to half a metre or so in size form an arcuate foreshore several metres high and extending a few hundred metres east from Dennes Point past Kellys Point.

Conservatively, some 15,000t of loose cobbles and boulders are exposed. About 10% of the material is Permian-age siltstone and sandstone cobbles and boulders, eroded from coastal cliffs and shore platforms to the east.

Recent coastal erosion has exposed dolerite boulders and cobbles present under sand on neighbouring beaches to the south, and a spit of dolerite boulders has formed between low and high water mark on Boulder Point.

Some say the boulder deposit is man-made – possibly ballast left by ships. A moment’s reflection shows this can’t be true: on the world stage, dolerite is a rare rock and is hardly likely to have been carried from overseas in large amounts by arriving ships; furthermore, departing vessels would either be in cargo or ballast, and if the latter, would hardly have dumped it just after leaving Hobart for the open sea. In any case, rounded boulders are scarcely a safe cargo in a rolling ship.

Dolerite boulders occur elsewhere on foreshores on the western side of the Derwent Estuary – notably from Taroona north to near Blinking Bill Point at Sandy Bay – where they are clearly being winnowed out of Tertiary-age boulder beds. On the northern tip of Bruny Island, Chris thinks the arcuate form of the boulder deposits wrapping around Kellys and Dennes Points is a rare recurved boulder spit, probably formed from winnowed boulders moved by storm swells refracting into the northern end of D’Entrecasteaux Channel.

Recurved sandy spits are a relatively common feature on the Tasmanian coast, but are rare in material as coarse as these boulders.

Locally, the boulders appear to be actively eroding from a weakly cemented conglomerate on Kellys Point. I think the conglomerate was formerly much more extensive, is probably Tertiary in age, and was the source material for the recurved spit.

Two maps showing the location of Dennes Point, the northern-most township on Bruny Island
The location of Dennes Point, the northern-most township on Bruny Island, Tasmania
Dennes Point, looking south from the entrance to D’Entrecasteaux Channel. The dolerite boulders forming the spit curving away along the channel stand several metres above high water mark.
Dennes Point, looking south from the entrance to D’Entrecasteaux Channel in February 2015. The dolerite boulders forming the spit curving away from the camera along the channel stand several metres above high water mark.
Dolerite boulders at Dennes Point, looking west from Kellys Point. The staff in the foreground is 5m long.
Dennes Point, looking west from Kellys Point. The dolerite boulders slope seawards at about 15°. The staff in the foreground is 5m long.
Dennes Point, looking west from Kellys Point showing the dolerite boulder deposit extending inland from the foreshore and disappearing beneath grass cover. The seawards slope here is about 250.
Dennes Point, looking west from Kellys Point. The dolerite boulder deposit extends inland from the foreshore, disappearing beneath grass cover and more recent Holocene aeolian sand. The seawards slope here is about 25°. The staff in the foreground is 3m long.
At Kellys Point, looking south to a weakly-cemented orange-brown boulder and cobble bed of rounded dolerite clasts, smaller angular sandstone and siltstone clasts, in a silt/sand matrix.
Kellys Point, looking south up to a weakly-cemented orange-brown boulder and cobble bed (a conglomerate) consisting of rounded dolerite clasts, and smaller angular sandstone and siltstone clasts, in a silt/sand matrix. Boulders are actively being eroded from the bank. I think the boulder bed might be Tertiary in age, that it was formerly much more extensive, and is the source of the material making up the recurved spit.
Detail of the (possibly) Tertiary conglomerate on Kellys Point, Bruny Island. A staff with values in decimetres is placed on the ground for scale.
Detail of the Tertiary? conglomerate on Kellys Point. The numbers on the staff are decimetres.
Looking east from Kellys Point, past the Tertiary? conglomerate at right, with sandstone and siltstone clasts on the foreshore. A 2.5m long staff is placed in the foreground for scale.
Looking east from Kellys Point, past the Tertiary? conglomerate at right. Sandstone and siltstone clasts on the foreshore become relatively more common to the east. The staff is 2.5m long.

Looking west towards Kellys Point, from a shore platform cut into Permian siltstone and sandstone showing the eastern extent of the dolerite boulders.
Looking west towards Kellys Point, from a shore platform cut into Permian siltstone and sandstone. This location marks the eastern extent of the dolerite boulders.

Filed Under: Vulnerable Coasts and Sea Levels

Foredunes and coastal development in Tasmania

March 5, 2015 by Bill Cromer Leave a Comment

Coastal planning and policy in Tasmania has been hindered by a use of ambiguous and undefined terminology in relevant coastal planning policy documents, notably the Tasmanian Coastal Policy (1996) and in some Local Government Planning schemes. The use of such terminology to define appropriate and inappropriate areas for coastal development has previously and will continue to result in vexatious planning disputes and poor coastal planning outcomes until it is corrected….

So says Chris Sharples in the Introduction to his discussion paper The problem of the use of ambiguous terms in Tasmanian coastal planning policy documents for defining appropriate coastal development zones (May 2012).

Inappropriate coastal landform terminology in Planning Schemes and legislation is holding back coastal development. Chris’s paper tries to sort out conflicting and out-of-date thinking, and it should be mandatory reading for all of us working in this area.

Chris has kindly allowed me to make his paper freely available as a downloadable pdf on this website (link below). Hopefully it will generate some comment.

Download Chris Sharples’ paper on coastal dune terminology in Tasmania (PDF Document 547kB)

Filed Under: Vulnerable Coasts and Sea Levels

Coastal cliffs and high resolution photogrammetry

July 9, 2013 by Bill Cromer Leave a Comment

I am facilitating a PhD research project by the School of Geography and Environmental Studies funded by a local Council in southern Tasmania. The residential area is known for large-scale, slow-moving landslides but the extent and rate of recession of adjacent coastal cliffs is unclear.

The initial aim of the photogrammetry research is to get high definition imagery of a short section of cliff line using small unmanned aircraft, in particular where parts of the cliff are vegetated and parts unvegetated, to see if the method can effectively eliminate vegetation effects and so detect small scale changes to the whole cliff surface irrespective of vegetation cover. If successful, the approach could be extended further along the several kilometres of cliffs in the area, and further afield.

The first photogrammetry run will be in the next month or two.

Filed Under: Vulnerable Coasts and Sea Levels

Vulnerable coasts and groundwater

May 25, 2013 by Bill Cromer Leave a Comment

Hydrogeologist Mark Hocking from Victoria and I have teamed up on various hydrogeological projects in the past few years – including surface and groundwater management for Venture Minerals Ltd’s tin, tungsten and iron ore prospects in western Tasmania. Mark’s expertise is computer groundwater modelling.

The successful presentation/discussion on 23 May at Kingborough Council south of Hobart attracted a diverse audience of 35 researchers, planners, engineers and others with an interest in how climate change will affect coasts.

Our main message was that shallow water tables in coastal areas have been neglected when predicting flood scenarios under rising sea levels and high rainfall events. Both combine to exacerbate water table rise, so that coastal inundation maps predicting the extent of flood events may need to be revised for some areas. Mark presented a predictive numeric computer model (a Tasmanian first for soft coasts) of various water table scenarios affecting the coastal aquifer at Seven Mile Beach.  See Mark’s groundwater modelling report, and my groundwater monitoring report, produced for Clarence City Council. The modelling approach can be extended to other vulnerable coasts.

Email me for a pdf of the presentation.

Filed Under: Groundwater, Vulnerable Coasts and Sea Levels

Subscribe to my newsletter
Profile of Bill Cromer

Geologist, thylacine author, tennis player [more about me].

Contact Bill

  • Email
  • Google+
  • Twitter

PH 0408 122 127

INT +61 408 122 127

Recent Posts

  • Codes in the 2015 Tasmanian Interim Planning Scheme
  • Flowchart for applying the Tasmanian Acid Sulphate Soils Code
  • Flowchart for applying the Tasmanian Coastal Erosion Hazard Code
  • Tasmanian Landslide Code
  • Tasmanian On-site Wastewater Management Code

News Archive

View full archive

News Archive by Month

  • August 2016 (3)
  • May 2016 (2)
  • August 2015 (1)
  • June 2015 (2)
  • March 2015 (7)
  • February 2015 (1)
  • July 2014 (2)
  • June 2014 (1)
  • March 2014 (1)
  • December 2013 (2)
  • November 2013 (1)
  • October 2013 (6)
  • July 2013 (3)
  • May 2013 (2)

Professional Services

  • Geotechnical Investigations
  • Soil Testing
  • Groundwater
  • Wastewater
  • Coasts

Products

  • Cromer Hydrogeological Calculators
  • Cromer Constant Head Field Permeameter
  • Trench® Wastewater Software

News Categories

  • Apps & Software
  • Cromer Permeameter
  • General
  • Geology
  • Geotechnical Investigations
  • Groundwater
  • Landslides
  • Thylacine
  • Vulnerable Coasts and Sea Levels
  • Wastewater
  • Home
  • Professional Services
  • Products
  • About
  • News
  • Publications
  • Contact me

Contact

  • Email
  • Google+
  • Twitter

PH 0408 122 127

INT +61 408 122 127

Copyright ©2025 Bill Cromer. All Rights Reserved.